STATISTICAL
ANALYSIS FOR THE SPANISH CASE:
|
CHART OF DATA |
|
|
The
total group under study (N) |
144 |
|
Participants (n) |
100 |
|
Percentage
of population having or lacking the characteristic under study (p = q) |
0,5 |
|
Reliability |
95% |
|
Units
of standard deviation in the normal distribution (Z) |
1,96 |
|
Standard error (SE) |
5,44% |
1) Sex
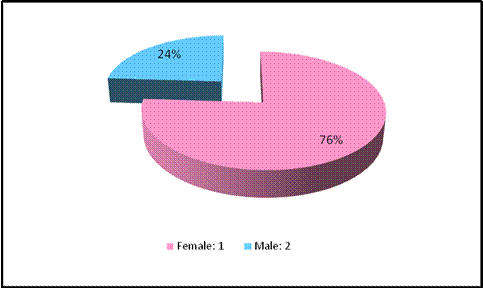
Figure 1. Sex (Aula de Mayores, Málaga University)
The results obtained show that
a vast majority of people participating in the study are female, an aspect that
correlates the reality of the population attending the University for the
elderly in Málaga, most of whom are women. And, in this regard, it is
interesting to note that when observing the attitude that the learners tend to
exhibit in the practical workshops, lectures and other kinds of academic
activities offered to them, female students are not only more, quantitatively
speaking, but also more ready to take a more active role and to engage fully in
the tasks set. This may be either due to the fact that women (not only
housewives, but also those who have also enjoyed a professional career as well)
are accustomed to perform more than one activity and they do not see it as
something challenging or awkward, but, on the contrary, it is a circumstance that
has long been a defining characteristic throughout their whole life. On the
other hand, most men are familiar with having had their working hours during
their working life, in which they were focused in the job to do, and then went
back home and found that everything there had been arranged by their wives. Any
task may be too demanding for some of them, who believe that attending the
University is, in itself, a hard task, so they are more reactive than women,
who, as we have already anticipated, show a fully committed attitude and are
pro-active, meaning invaluable for the effective development and low-anxiety
atmosphere of the classes. Women usually do their homework more often and also
more acurately than men (women devote much more time and show more interest in
true learning), ask more questions in class and volunteer more easily.
Interestingly to note,
however, is the fact that when a male student has a high self-image as a
learner and is really interested in learning, his participation in class is not
only more sound and frequent that those by women, but more outstanding. Women
tend to avoid to call other’s attention. Men, when participating actively, seem
to show a need to be praised and congratulated. It is as if a kind of
leadership (naturally emerged or induced somehow) were inherently linked to men
in this social group.We cannot neglect the fact that, despite the meaningful
progress that has already taken place in the last decades insofar as the equality
among men and women, however the prevailing social atmosphere in which our students,
all of them over 55, were brought up did not resemble at all such equality.
2) Marital status
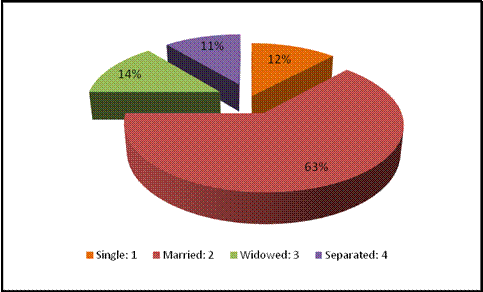
Figure 2. Marital status (Aula de Mayores, Málaga University)
By looking at the graph we
immediately notice that the group of learners who live alone is almost half in
size than those who are married. An interest in meeting new people and
socialising, apart from an interest in developing academic skills and gaining
contents in certain areas, is undoubtedly one of the major causes of initiating
this type of actitivy at the University. In personal interviews, many students
have reported how hard it was to have whole days ahead with nobody else to be
with and without any serious responsibility once they got retired. They needed
the contact of people, they wanted to meet people who were under their same
life circumstances, with plenty of leisure time, and with common likes and
interests.
According to the idea
previously stated, one may wonder why it is then that so many married people chose
the University activities as well, if, obviously, they are not looking for new
people to enter into their life as they already have got a family and not much
free time. However, in informal talks with the students, two situations clearly
differentiated stand out, namely: (1) those marriages in which they get along
with each other so well and both members of the couple attend the University
and (2) those other kinds of people who, though remaining married, they do so
simply because from the perspective of someone at their age, it is easier that
obtaining a divorce; but, in reality, they share almost nothing with their
couple and are eager to meet new people and make friends to share trips, walks,
or other free time activities with. After all, for people at the range age (55
and over in the case of our University), marriage is still an important institution
and most of them got married when they were very young.
3) Age
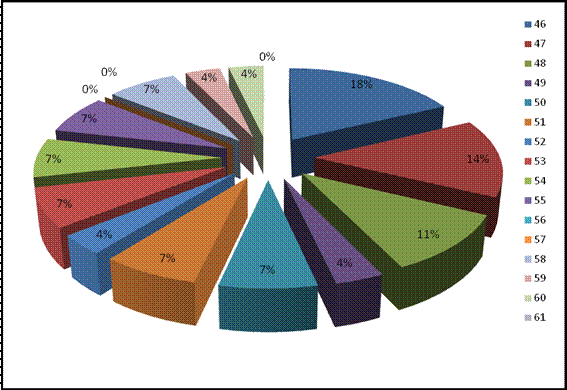
Figure 3. Age (Aula de Mayores, Málaga University)
The scope of the age of the participants in the study ranges between 46 and 80 years old, the vast majority being in their fifties and sixties. Reasons for this being so could be found in the quality of life of people above that age (basically, the ability to drive by themselves that gets significantly reduced with the passage of time plus the possibility of personal manoeuvre and moving around, which also gets considerably reduced as time goes by and people get older) and in the fact that people may get retired in Spain with certain jobs at the age of 55 and onwards, whereas the majority retire when they are 65 or over.
Interestingly, it should be noted the extent to which (1) the social nature of human beings and (2) the interest in going on learning and learning remains untouched till the very last moments of our life. Though quantitatively speaking, the group of people above 70 and 80 who participated in the study is not meaningful, from a less scientific, more holistic perspective, their attendance to class is absolutely enriching as (1) they have a wide life expreince that they offer to the rest of participants and from which everybody may raise awareness on several aspects of life, (2) their attitude proves that human beings have an inherent ability and wish for growing on learning endlessly and (3) they teach how you can overcome the limitations that constrained your life in the past and learn to use any kind of machine or device simply by maintaining an open and flexible mind. Impossible is nothing, as they put it. Teachers and trainers should be careful and sensitive to cover the needs of this particular group of students so that their motivation to learn does not decrease.
4) Do you
live alone?
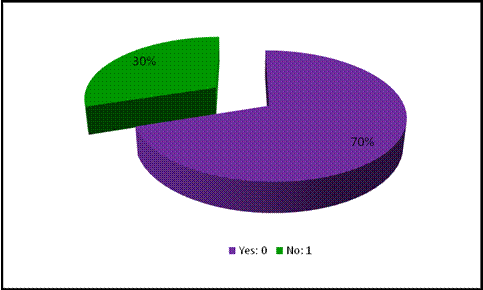
Figure 4. Living alone (Aula de Mayores, Málaga
University)
It is strikingly remarkable that
whereas in item 2, in which we asked the students to indicate their marital
status, a majority of 63% stated being married, now we are faced with a group
of 70% of the students who declared living alone, a percentage that undeniably
clashes with the one referred to just before. A potential explanation for this
is, as we anticipated above, that many of them are still legally married,
however they share hardly anything with their couple. So they feel as if they were reallistically alone.
Hence their interests in attending the University as a meeting point for people
who share likes and hobbies.
Whatever the explanation
underlying the fact, the thing is that an ample part of the students are happy
with the opportunity of meeting new people and making friends that the
University offers for people at that age range.
5) Qualifications
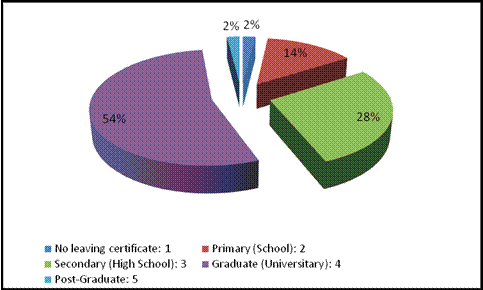
Figure 5. Qualifications (Aula de Mayores, Málaga
University)
People from very different educational backgrounds attend the “Aula de Mayores”. In fact, there are no requisites in this regard. There is a slight majority of graduated people, 56% vs 44% of undergraduate. This makes a very heterogeneous class which becomes even more if we take into account their fields of specialization, for those who had one. With this scenario, it is of uppermost importance that the teachers and trainers working with these students are always prepared to change whatever necessary in class so that everybody can really engage in what is being delivered there. Avoiding exclusion at all costs is a must. Things will have to be repeated at times, and almost nothing should be taken as already known by them. Also, the variety of activities should be comprehensible enough so that people with different cognitive styles and also with different learning skills and previous (or no) learning experiences may all go at the same pace. Often, peer learning means the solution to the different rhythms for learning; learners working together may benefit from something their mates have already grasped, and equally true, those who are supposed to have already learned something may test their true degree of learning &/or reinforce what’s been previously learned by explaining the issue in question to the person sitting next to him/her.
Whereas having a heterogeneous class is always known to be an extremely challenging experience in the world of teaching, in the particular case of teaching adults, their maturity, degree of commitment, motivation to learn, sense of humour, the attention devoted, their sensibility and respect towards the teacher, their pertinacy ... all make a class atmosphere so nice and inviting that teachers working with them find their task twice as motivating and enriching than teaching any other target students.
6) Current
occupation/job
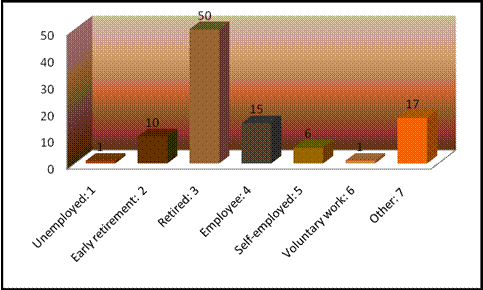
Figure 6. Current ocupation (Aula de Mayores, Málaga
University)
In agreement with what has
been analysed so far, we can observe at this point that a group of 61% are
retired or unemployed. The remaining 39% have got a job or co-operate in voluntary
tasks. All in all, there is still a predominant group of students with lots of
free time to devote to learn whatever interests them, a reason powerful enough
to attend classes at the University in a very positive mood. The variable
“having free time” together with “learning something that is not compulsory but
optional” makes an effective team of circumstances that self-drive learners to
attain their pursued goal, the learning of certain contents or the development
of certain skills.
7) Need to
learn how to use ICTs
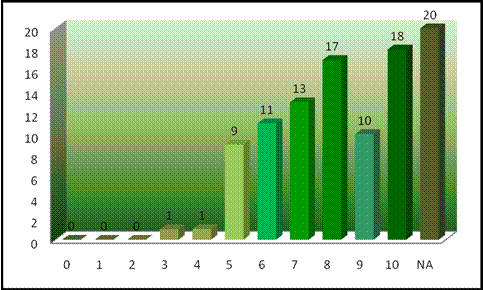
Figure 7. Need to learn ICTs (Aula de Mayores,
The need to become competent
to use the ICTs has scored high in the students system of preferences. There is
a group of 78% who value it to a different degree. The need to do something in
life is as powerful a drive as any other personal circumstance such as
motivation, desire, want and so on.
Those learners who need to learn something, regard it as important, so
they do not mind having to invest great doses of effort and time to make their
target feasible. They simply pursuit the learning in question and make
everything possible to obtain the best result. So they learn better and more
than the other average students who lack such need. We can expect a good
performance on the part of our students after the period of instruction and
training partly because of their stated need to learn..
8) Interest
in ICTs
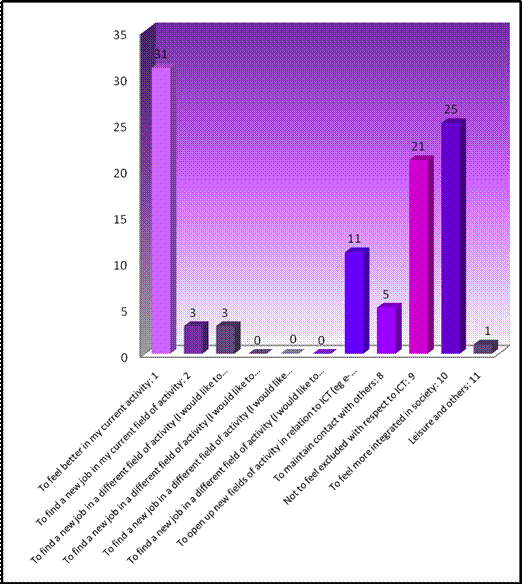
Figure 8. Interests in ICTs (Aula de Mayores,
Many and different are the
reasons given by students for their high degree of interest in learning to cope
with the ICTs successfully, but there are 4 which stand out distinctively,
namely: (1) Feel better in whatever they do, 31% of the group; (2) Avoid a
feeling of exclusion concerning the ICTs, 25% of the group; (3) Socialise and
keep contact with other people, 21% of the group; slightly lower, but pointing
to the social sensitivity of our students, is their interest in applying their
ICTs skills to co-operate with different NGOs –a group of 11%.
Our informants’ motives have
essentially a twofold nature:
(a) because society progresses
and new advancements have come to change our life for the better, our students are
aware that it is neither helpful nor constructive to get frightened of not
being able to cope with them successfully and neglect them as if they did not
exist. On the contrary, it proves a much more mentally-healthy attitude to do
one’s best to learn step by step how to use them and get progressively familiar
with their benefits in one’s daily life.
(b) as we could foresee in
previous items, our students acknowledge the social dimension of ICTs. This
viewpoint reinforces the idea anticipated above that the social constituent of
human beings is highly appreciated by people regardless of their age. People assess
their social links as invaluable. In fact, psychologists claim that a person
could scarcely survive if s-/he is poorly nourished, whereas a person without
love from others or isolated would sooner or later hopelessly die of sadness.
Maintaining social contacts is vital for everybody.
9) What do
you mainly use ICTs for?
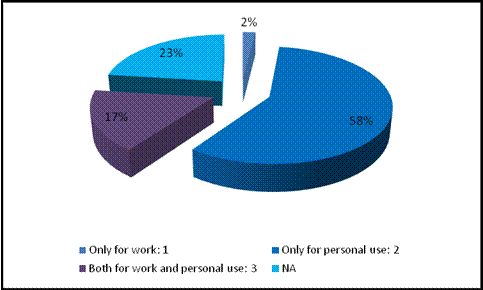
Figure 9. Uses of ICTs (Aula de Mayores, Málaga
University)
The prevailing answer to this
item is that which underlines that the potential of ICTs enhance the
possibilities of a much better quality of life. You may find almost everything
if you know how to search successfully, people often say. From getting
information about a topic of our interest, to finding news, directions, music,
instructions on how to do something, e-learning, visiting a museum virtually or
getting into contact with someone, ... everything is on the net. 58% of the
group affirm being aware of the advantageous position that being competent at
using PCs brings you and consequently that they use them for different personal
aspects of their life.
10)
State
those ICTs that you have at home and use regularly
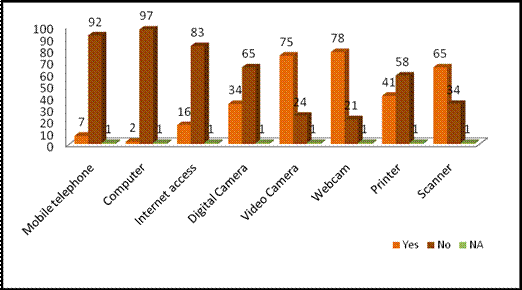
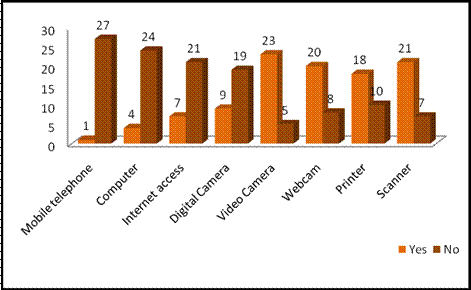
Figure 10. ICTs at home (Aula de Mayores,
These are the ICT devices that
our students have got and enjoy most frequently:
(a)
a PC, a group of 97%,
(b)
a mobile phone, a group of
92%,
(c)
access to the internet, a
group of 83%,
(d)
a digital camera, a group of
65%,
(e)
a printer, a group of 58%,
(f)
a scanner, a group of 34%,
(g)
a digital videocamera, a group
of 24%, and
(h)
a webcam, a group of 21%.
11)
Can
you count on someone to help you if you have problems when using the ICTs?
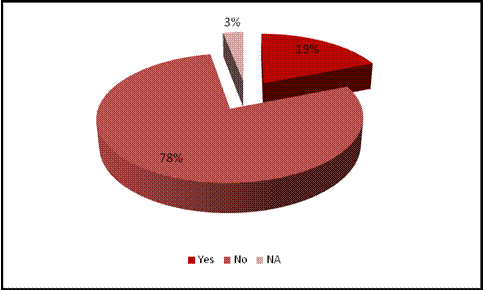
Figure 11. Help in ICTs (Aula de Mayores,
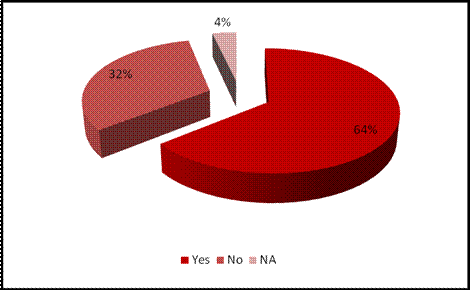
Only 19% of the
students are straightforwardly helped in case they find obstacles when using
the ICTs. On the contrary, a group of 78% have nobody to help them when this
occurs. This variable has a critical effect on the process of learning. As it
may happen to any of us when trying to learn something, at the beginning of a
new learning process, learners are usually highly motivated at the realization
of the meaningful avenue of new possibilities which is about to open for them.
They want to practice as much as possible, both inside and outside class. But
our motivation may increase, or, on the contrary, decrease depending on the
conditions that support (or prevent) our accumulation of practice. If we can
easily find someone to assist us, if we find something that stop our
progression, we get happy and go on in an untroubled way. Contrarily, if we
want to practice but the PC does not work and we do not know why, or there is
something that we do not understand and still we can’t continue with what we
were doing, we may easily get demotivated and get somewhat reluntant to
continue practicing on our own. That is why we reckon it of uppermost importance
the development any system of consultation by means of which the learners could
feel supported as regards their daily uncertainties concerning the effective
use of ICTs. An example of this could be the settlement of a body of
technological volunteers that should perform as either as on-line or present tutors
or consultants, as they already do in other different institutions.
12) Who
helps you when you find difficulties in using ICTs?
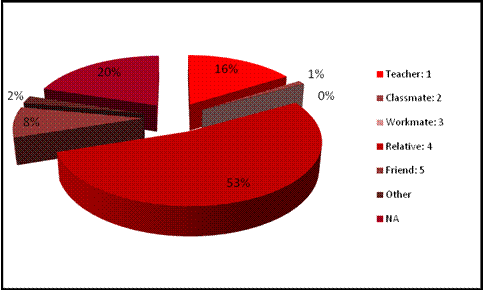
Figure 12. People helping in ICTs (Aula de Mayores,
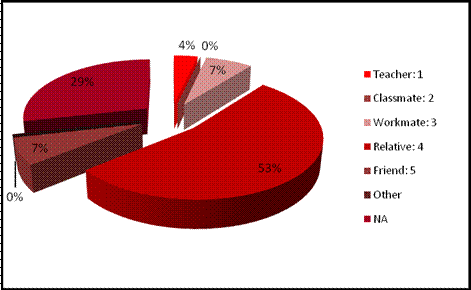
When difficulties emerge while
using the ICTs, most of our informants (a group of 53%) report resorting to a
relative or someone in their family to help them solve the problem. For a group
of 16%, the class is of vital importance, not only in giving sequenced
guidelines for progressing in their learning, but also when they can turn to
their teacher and s/-he explains the trouble in question. For this group, it is
the teacher who is crucial in finding out a solution to what they were unable to
do when being faced with the ICTs on their own. Once again, as we suggested
before, counting with some kind of assistants to support the teachers’ task
would be invaluable.
13)
What do you use
your PC for?
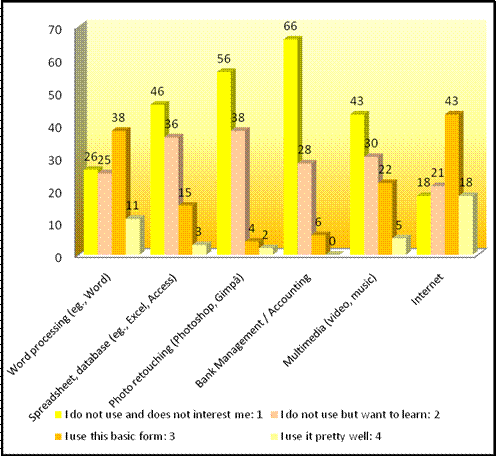
Figure 13. Uses of a PC (Aula de Mayores,
The myriad of
reasons for the use of the PC may be countless. Yet, most of them do not show
interest in learning many of the possibilities that the use of PC does offer
(such as database, accounting, multimedia, photograph retouching, and so on).
Only 43% of the students claim to enjoy the most essential skills to surf the
net basically and another group of 38% of them affirm to be able to cope with
word processor. In the case of our students, the internet and the use of word
processor stand quite ahead if compared to any of the many possibilities that
PCs have.
14) What do you use the Internet for?
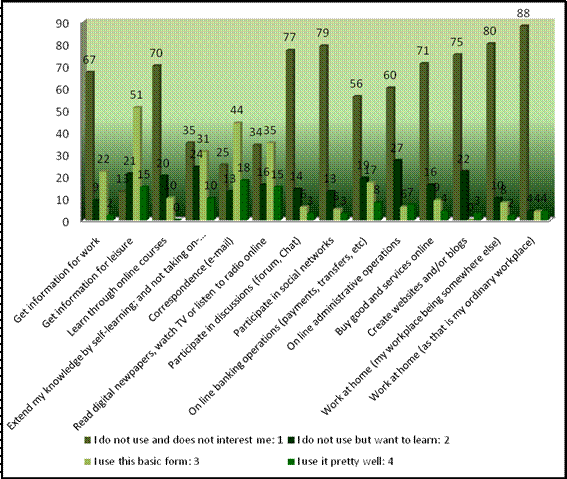
Figure 14. Uses of Internet (Aula de Mayores,
Exactly the same as it happens with the manifold possibilities that an effective use of the PC may provide the user with, being good at using the internet efficiently may avail the user of multiple advantages. Still, our students do not seem to be very interested in knowing in depth many of them. They are happy with being able to send and to receive e-mails (a group of 18% agree on this), to obtain data related to leisure time activities (a group of 15% say so) and to access to the news on-line, such as reading newspapers, watching TV or listening to the radio (a group of 15% feel so). Other minor cohorts of students value the opportunities for self-learning (10% of them) or for getting access to the data regarding their bank account (8% of them).
15) How many hours a week do you usually use your PC?
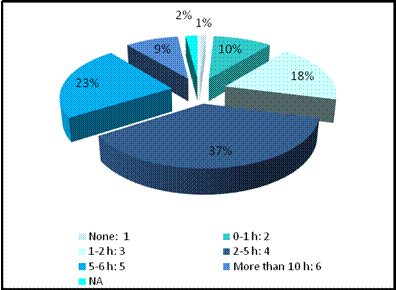
Figure 15. Hours a week using a PC (Aula de Mayores,
In order to get familiar with
something, a great amount of time, together with systematicity, is generally
required. At the beginning, the situation may surpass the learner, yet the
accumulation of practice makes the student’s self-image and self-confidence progressively
grow and thus the improvement becomes apparent in most cases. Every learner can
assume this. Yet not all of our learners devote hours on end to become skilled
users. The majority of them (37%) estimate in 2 to 5 hours the time spent in
practicing per week. There is a group of 23% who spend more, 5 to 6 hours, and
another group of 9% of the learners who even spend longer than that, i.e.: more
than 10 hours a week, as they put it. Though 18% of them spend only 1 or 2
hours a week and 10% of the learners just one hour or less.
It is advisable to remark at
this stage that our role as teachers should not confine itself to imparting
instruction or giving explanations in the sense of presenting theoretical
contents, as if knowledge could be miraculously inherited by learners at the
hearing of them. Our task as responsible teachers should comprehend as well and
most importantly to provide our students with meaningful doses of helping them to
learn successfully. Actually, training learners to learn to learn is critical.
Particularly with adult students, who may lack strategies for effective learning
or bring with them certain unrewarding learning habits from the past that should
be necessarily removed. Teachers should devote class time to guide them in
reflecting upon what they do in order to grasp what it is to be learned and
help them find out learning techniques, strategies and habits that lead to
successful learning.
16)
How many hours a week do you
usually surf the internet?
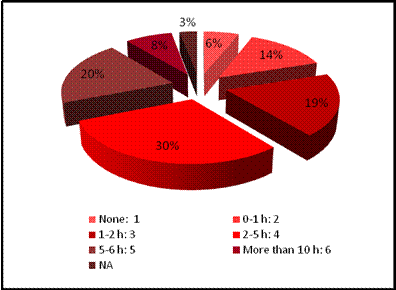
Figure 16. Hours a week using Internet (Aula de Mayores,
As was indicated above,
familiarising with something is just the result of accumulated time and
experience in doing it once and again. For our students to become good users of
the internet, many hours of practice are needed, so that they lose the initial
fear that may derive when one faces something unfamiliar or unknown and has to
cope with it.
In this sense, the most
important group of students (30% of them) reserve 2 to 5 hours a week to use
the net for different purposes. Then, there is a group of 20% who spend about
5-6 hours in doing so whereas an ellite of 8% report spending more than 10
hours per week engaged in doing different tasks on the net. A group of 19% can
only access the net for 1 or 2 hours per week, and, even worse, 14% of our
students –maybe those who do not have an internet connection at home— can only practice
for an hour or less, an amount of time which is clearly insufficient to become
a skilled user.
As we said earlier with other
aspects previously analysed, it is noticeable once more at this point, every
now and then we see that one of the most outstanding characteristics of this
kind of teaching situations with adult learners is the fact that the class is
always heterogeneous, with students with differring levels of skill or
knowledge, different rhythms for learning, and not always with the same
availability regarding their free time, something which undeniably poses a
challenge for the teachers responsible for them, as the situation becomes
absolutely stimulating, though extremely complex at the same time.
17) Range from 1 to 5

Figure 17. Range from 1 to 5 (Aula de Mayores,
When considering the impact that having received instruction on ICTs has had on the life of our students, the first thing that calls our attention is the fact the most outstanding percentages of people all point to a lack of noticeable changes in theit own perceptions of improvement. For example, they can’t appreciate meaningful changes in their quality of life or in the knowledge they are supposed to have acquired as regards possibilities in the world of work. Concerning this, important is to note that the age range of our students entails that they are not particularly interested in promoting professionally, but, quite on the contrary, most of them are already retired and others are about to retire in the immediate future. Thus, their interest for learning these aspects may be very low.
Leaving aside what they do not deem as fundamental or indispensable for their lives, let’s now focus on what they consider as invaluable:
(a) a group of 17% of our students express how they recognize the improvement in their capability to search information on the net effectively,
(b) a group of 13% of our students state that they have undoubtedly developed critical reading skills. From the huge amount of information available on the net, they now know what may interest them and disregard what is biased or simply lacks any real interest.
(c) another group of 13% of our students also declare the extent to which they notice the self-confidence they have gained. They now feel themselves much better prepared to face the real thing.
(d) a group of 12% of our students voice that their quality of life has improved in general: multiple and varied are the advantages that the internet has brought to their life.
(e) a group of 10% of our students specify that it is their social life in particular that has benefitted most, as they can easily contact family and friends by using the ICTs.
All in all, we
have been able to verify that the Internet is by far our students’ most
appreciated issue for learning, regarding the ICTs. They are pretty aware that
developing the skills for an effective use of the net will certainly avail them
of multiple advantages, not only concerning the on-going search for information
which our current society pursues but also as regards the improvement of our
social relationships in our immediate environment as well.
STATISTICAL
ANALYSIS FOR THE BULGARIAN CASE:
|
CHART OF
DATA |
|
|
The total group under study (N) |
30 |
|
Participants (n) |
28 |
|
Percentage of population having
or lacking the characteristic under study (p = q) |
0,5 |
|
Reliability |
95% |
|
Units of standard deviation in
the normal distribution (Z) |
1,96 |
|
Standard
error (SE) |
3,84% |
1) Sex
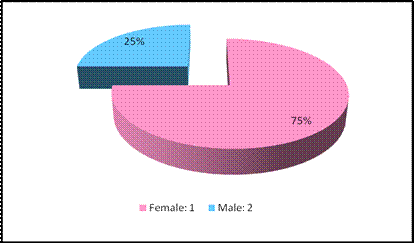
Figure 1. Sex
(Intelekti Ltd., Bulgaria)
2) Marital
status
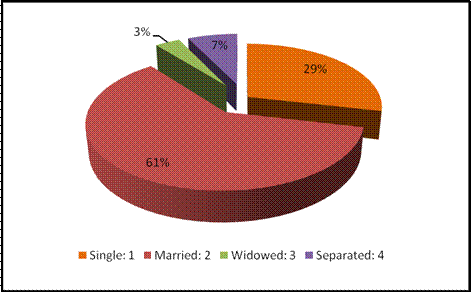
Figure 2.
Marital status (Intelekti Ltd., Bulgaria)
3)
Age
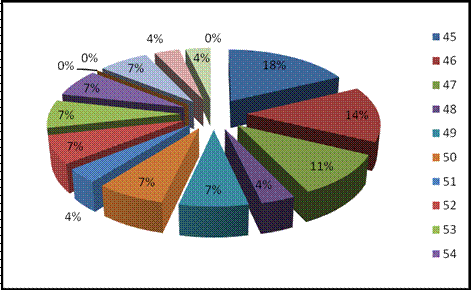
Figure 3.
Age (Intelekti Ltd., Bulgaria)
4)
Do you live alone?
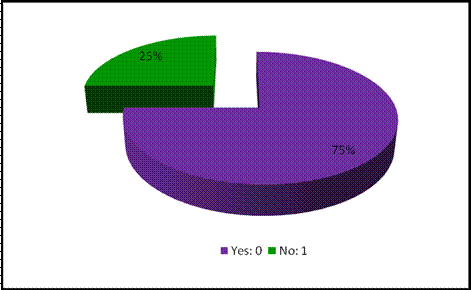
Figure 4.
Living
alone (Intelekti Ltd., Bulgaria)
5)
Qualifications
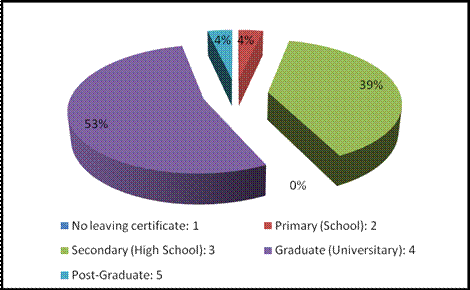
Figure 5.
Qualifications (Intelekti Ltd., Bulgaria)
6)
Current occupation/job
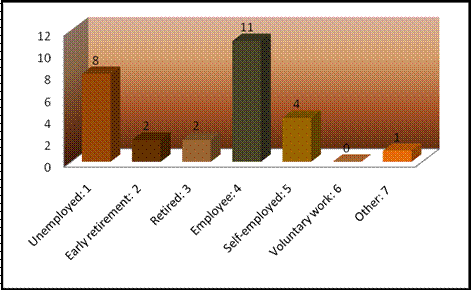
Figure 6.
Current
occupation (Intelekti Ltd., Bulgaria)
7) Need to
learn how to use ICTs
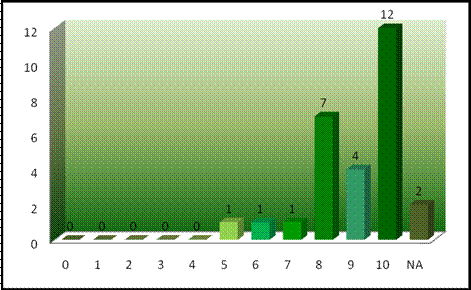
Figure 7.
Need
to lear ICTs (Intelekti Ltd., Bulgaria)
8)
Interest in ICTs
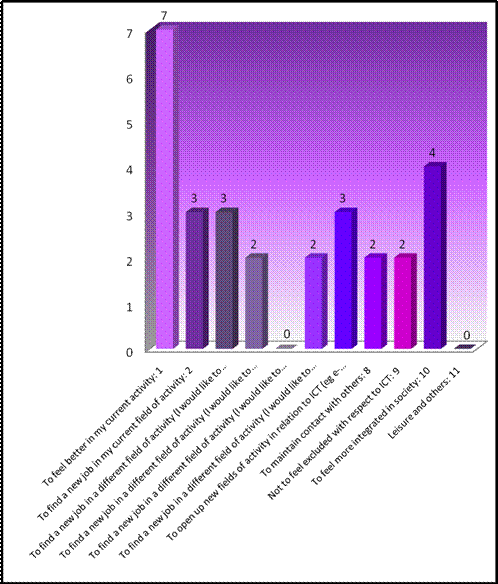
Figure 8. Interest in ICTs
(Intelekti Ltd., Bulgaria)
9) What do
you mainly use ICTs for?
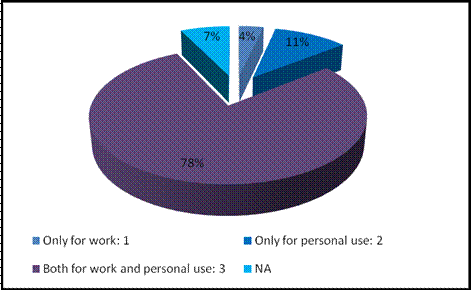
Figure 9.
Uses
of ICTs (Intelekti Ltd., Bulgaria)
10)
State
those ICTs that you have at home and use regularly
Figure
10. ICTs
at home (Intelekti Ltd., Bulgaria)
11)
Can
you count on someone to help you if you have problems when using the ICTs?
Figure
11. Help
in ICTs (Intelekti Ltd., Bulgaria)
12) Who helps you when you find
difficulties in using ICTs?
Figure
12. People
helping in ICTs (Intelekti Ltd., Bulgaria)
13) What do you use yor PC for?
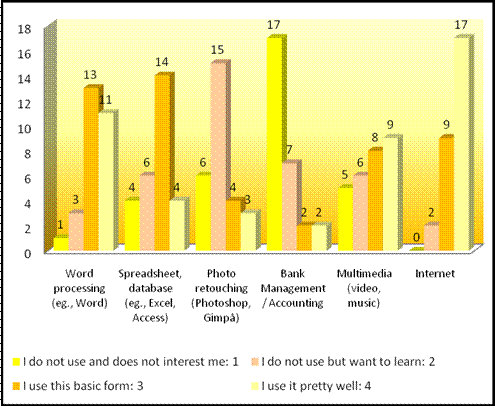
Figure 13. Uses of a PC
(Intelekti Ltd., Bulgaria)
14) What do
you use the Internet for?
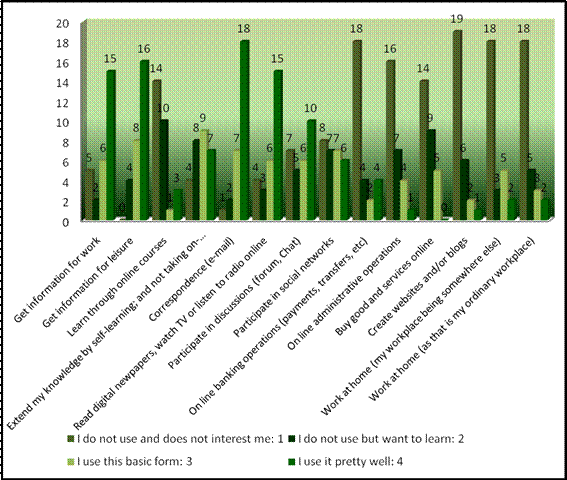
Figure 14. Uses of Internet
(Intelekti Ltd., Bulgaria)
15) How many hours a week do
you usually use your PC?
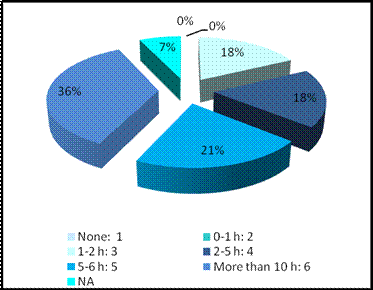
Figure 15. Hours a week using
a PC (Intelekti Ltd., Bulgaria)
16) How many hours a week do you
usually surf the Internet?
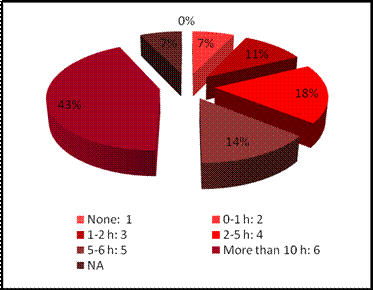
Figure 16. Hours a week using
Internet (Intelekti Ltd., Bulgaria)
17) Range
from 1 to 5
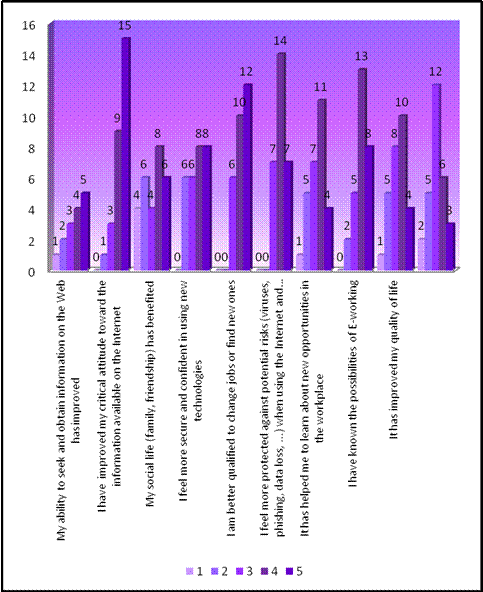
Figure 17. Range from 1 to 5
(Intelekti Ltd., Bulgaria)
STATISTICAL
ANALYSIS FOR THE ITALIAN CASE:
|
CHART OF
DATA |
|
|
The total group under study (N) |
23 |
|
Participants (n) |
19 |
|
Percentage of population having
or lacking the characteristic under study (p = q) |
0,5 |
|
Reliability |
95% |
|
Units of standard deviation in
the normal distribution (Z) |
1,96 |
|
Standard
error (SE) |
9,58% |
1) Sex
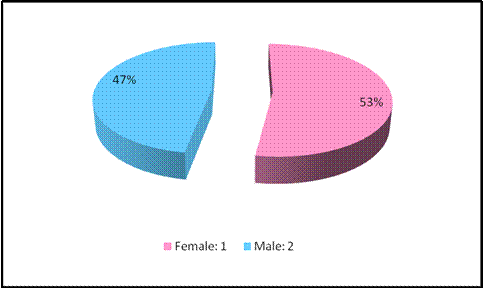
Figure 1.
Sex (FNP-CISL, Italy)
2) Marital
status
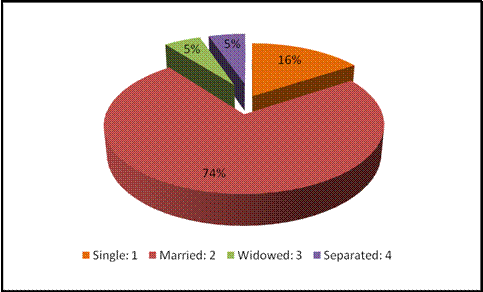
Figure 2. Marital status
(FNP-CISL, Italy)
3)
Age
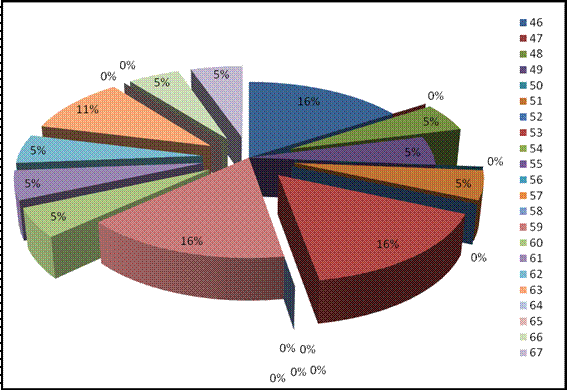
Figure 3. Age (FNP-CISL,
Italy)
4)
Do you live alone?
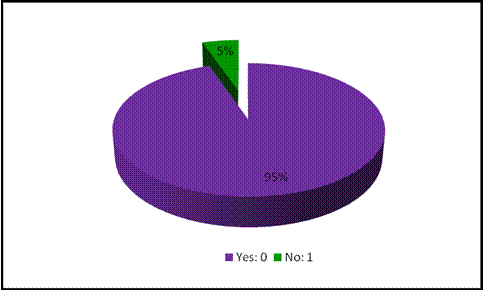
Figure 4. Living alone
(FNP-CISL, Italy)
5)
Qualifications
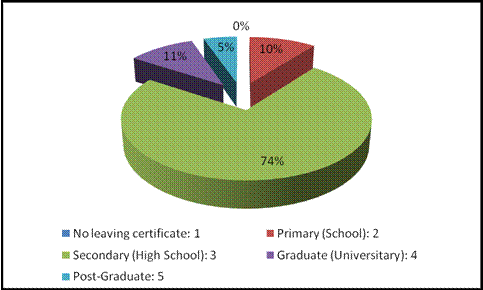
Figure 5.
Qualifications (FNP-CISL, Italy)
6)
Current occupation/job
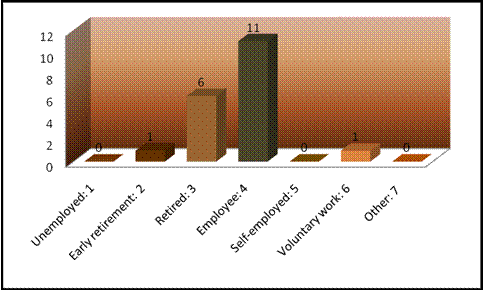
Figure 6. Current occupation
(FNP-CISL, Italy)
7) Need to
learn how use ICTs
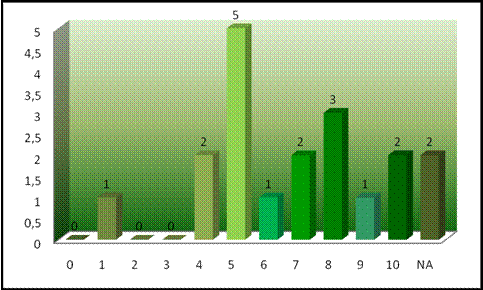
Figure 7. Need to learn ICTs
(FNP-CISL, Italy)
8)
Interest in ICTs
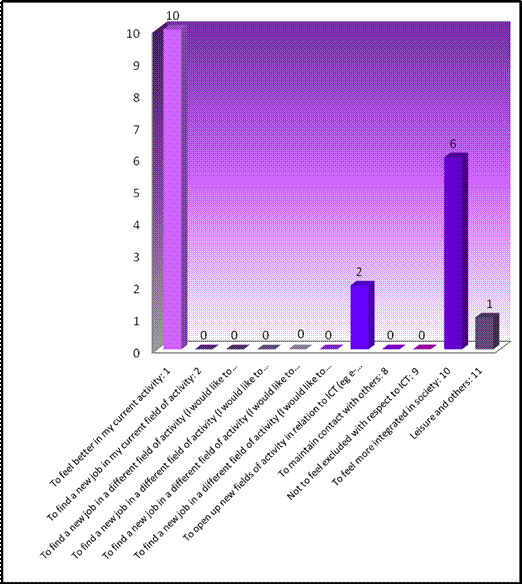
Figure 8. Interest in ICTs
(FNP-CISL, Italy)
9) What do
you mainly use ICTs for?
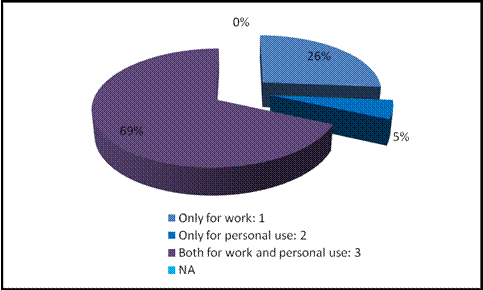
Figure 9. Uses of ICTs
(FNP-CISL, Italy)
10)
State
those ICTs that you have at home and use regularly
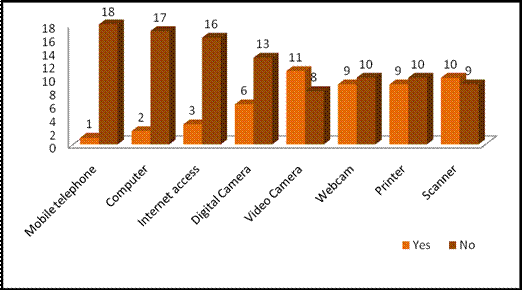
Figure 10. ICTs at home
(FNP-CISL, Italy)
11)
Can
you count on someone to help you if you have problems when using the ICTs’
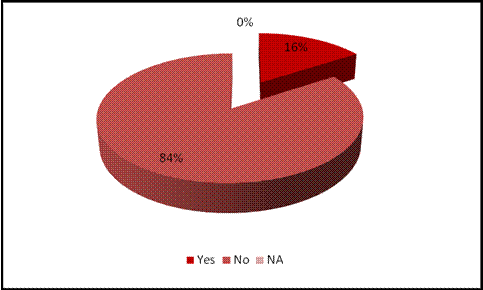
Figure 11. Help in ICTs
(FNP-CISL, Italy)
12) Who
helps you when you find dificultéis in using ICTs?
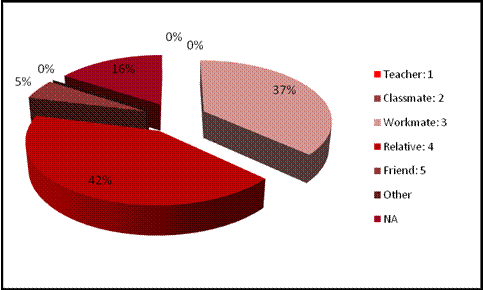
Figure 12. People helping in
ICTs (FNP-CISL, Italy)
13)
What do you use your PC for?
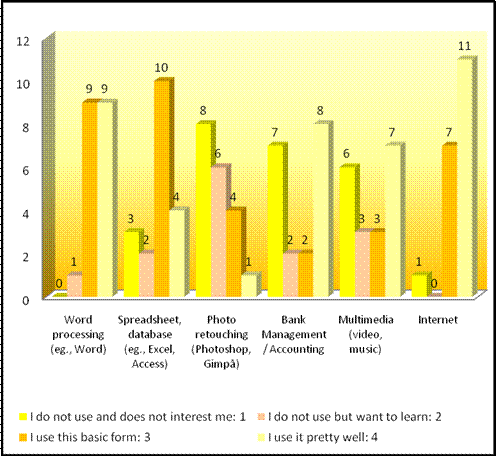
Figure 13. Uses of a PC
(FNP-CISL, Italy)
14) What do
you use the Internet for?
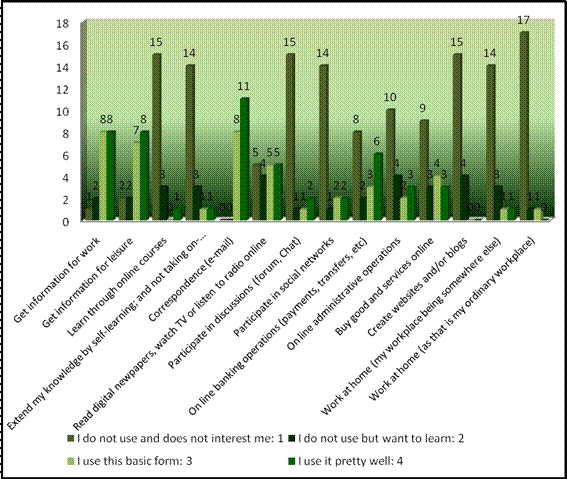
Figure 14. Uses of Internet (FNP-CISL, Italy)
15) How many
hours a week do you usually use your PC?
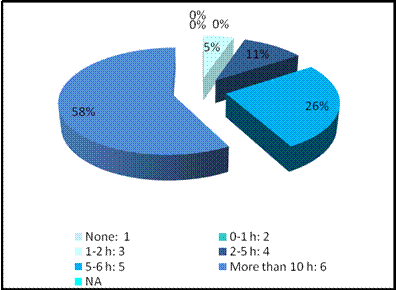
Figure 15. Hours a week using
a PC (FNP-CISL, Italy)
16)
How
many hours a week do you usually surf the Internet?
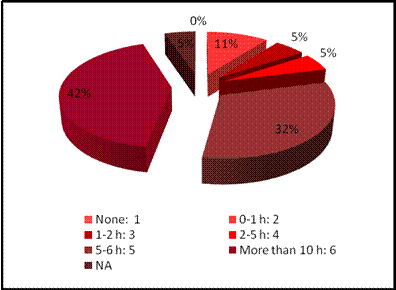
Figure 16. Hours a week using
Internte (FNP-CISL, Italy)
17) Range
from 1 to 5
None dates for Italian case
STATISTICAL
ANALYSIS FOR THE ESTONIAN CASE:
|
CHART OF DATA |
|
|
The
total group under study (N) |
|
|
Participants (n) |
|
|
Percentage
of population having or lacking the characteristic under study (p = q) |
|
|
Reliability |
|
|
Units
of standard deviation in the normal distribution (Z) |
|
|
Standard error (SE) |
|
1) Sex

Figure 1. Sex
(YSBF, Estonia)
2) Marital
status
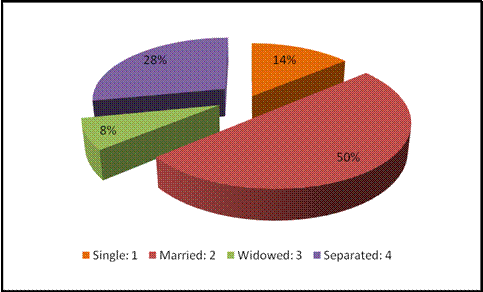
Figure 2.
Marital status (YSBF, Estonia)
3)
Age
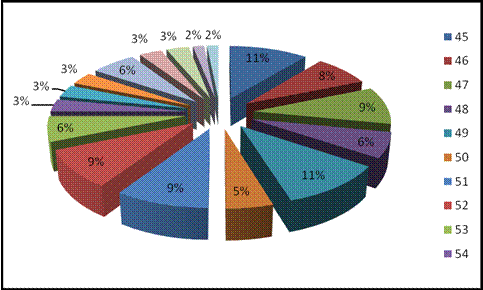
Figure 3. Age
(YSBF, Estonia)
4)
Do you live alone?
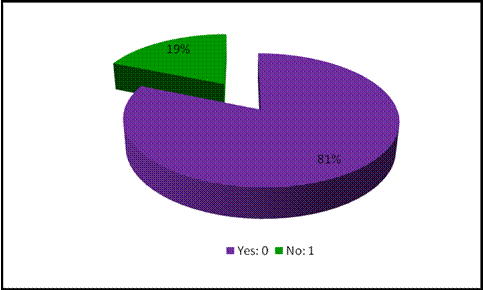
Figure 4.
Living alone (YSBF, Estonia)
5)
Qualifications
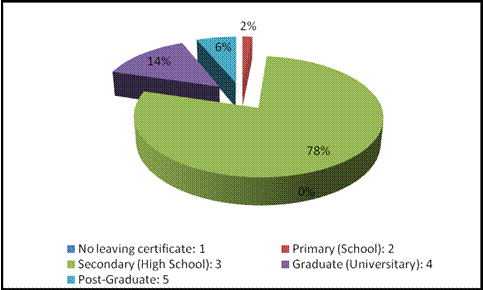
Figure 5.
Qualifications (YSBF, Estonia)
6)
Current occupation/job
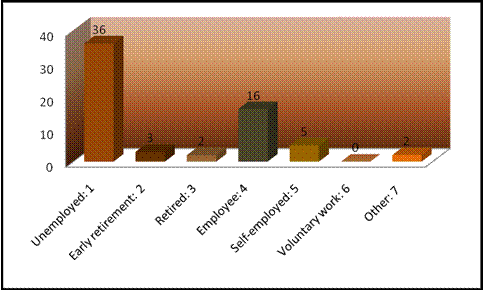
Figure 6. Current occupation
(YSBF, Estonia)
7) Need to
learn how to use ICTs
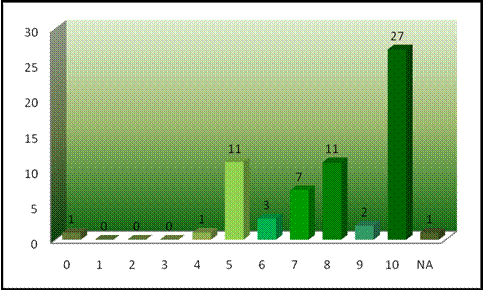
Figure 7. Need to learn ICTs
(YSBF, Estonia)
8)
Interest in ICTs
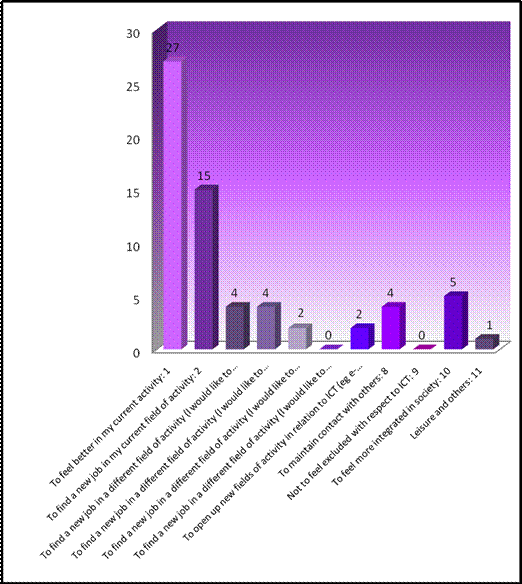
Figure 8. Interest in ICTs
(YSBF, Estonia)
9) What do
you mainly use ICTs for?
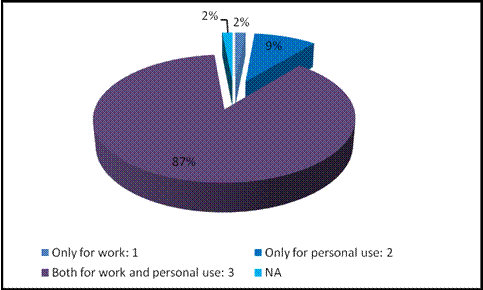
Figure 9. Uses of ICTs (YSBF,
Estonia)
10)
State
those ICTs that you have at home and use regularly
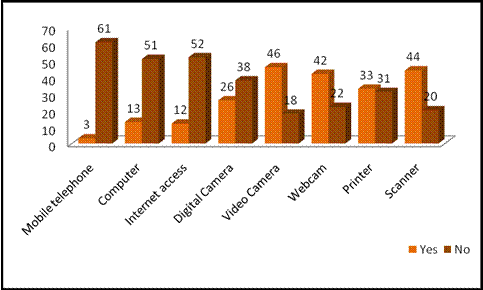
Figure 10. ICTs at home (YSBF,
Estonia)
11)
Can
you count on someone to help you if you have problems when using the ICTs?
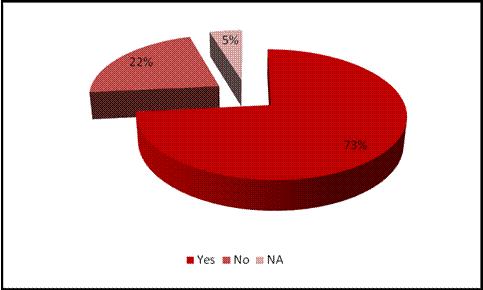
Figure 11. Help in ICTs (YSBF,
Estonia)
12) Who
helps you when you find dificultéis in using ICTs?
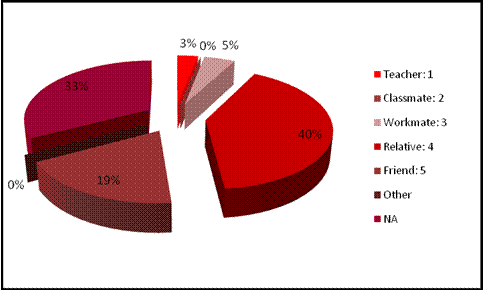
Figure 12. People helping in
ICTs (YSBF, Estonia)
13)
What do you use your PC for?
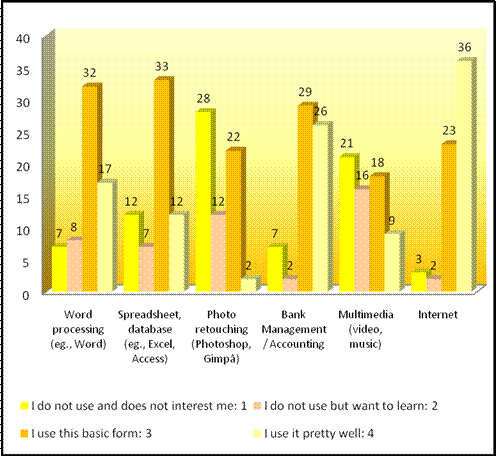
Figure 13. Uses of a PC (YSBF, Estonia)
14) What do
you use the Internet for?
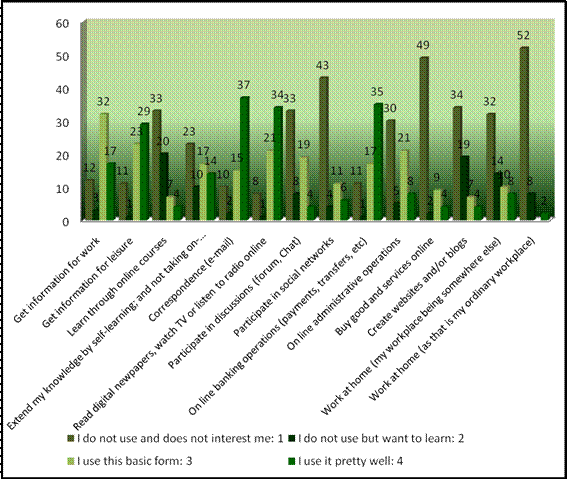
Figure 14. Uses of Internet
(YSBF, Estonia)
15) How many
hours a week do you usually use your PC?
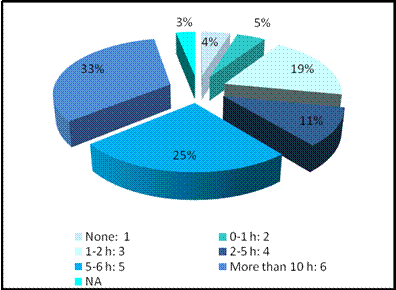
Figure 15. Hours a week using
a PC (YSBF, Estonia)
16)
How
many hours a week do you usually surf the Internet?
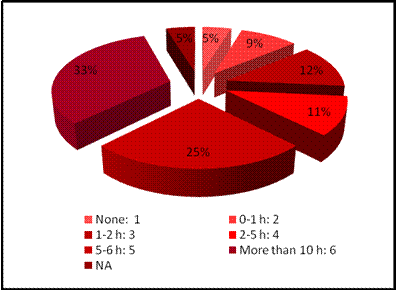
Figure 16. Hours a week using
Internet (YSBF, Estonia)
17) Range
from 1 to 5
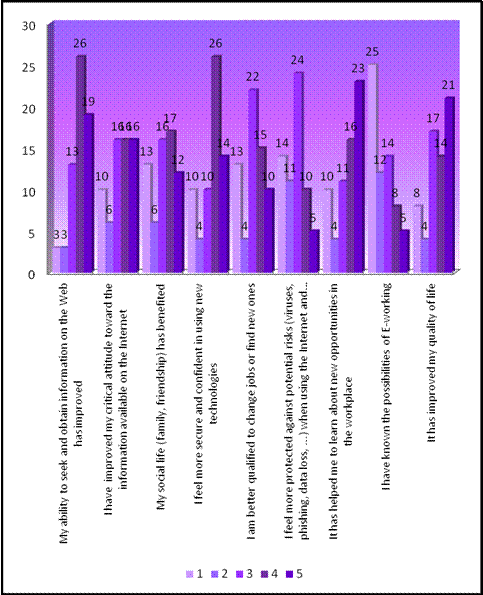
Figure 16. Range from 1 to 5
(YSBF, Estonia)
STATISTICAL
ANALYSIS FOR THE HUNGARIAN CASE:
|
CHART OF DATA |
|
|
The
total group under study (N) |
|
|
Participants (n) |
|
|
Percentage
of population having or lacking the characteristic under study (p = q) |
|
|
Reliability |
|
|
Units
of standard deviation in the normal distribution (Z) |
|
|
Standard error (SE) |
|
1) Sex
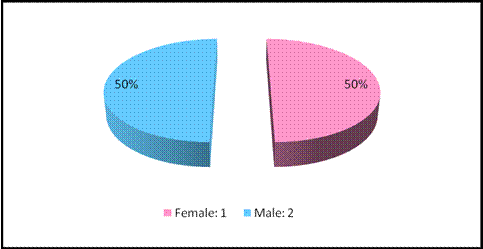
Figure 1. Sex (Net-Mex Ltd.,
2)
Marital status
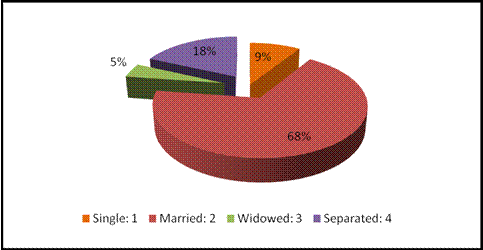
Figure 2.
Marital status (Net-Mex Ltd., Hungary)
3)
Age
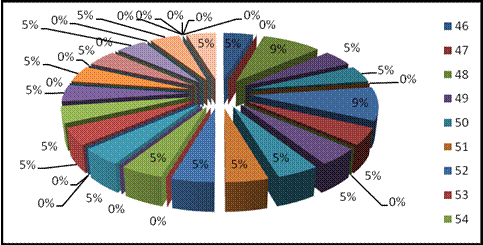
Figure 3. Age (Net-Mex Ltd.,
Hungary)
4)
Do you live alone?
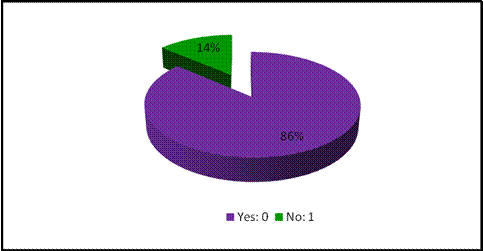
Figure 4. Living alone
(Net-Mex Ltd., Hungary)
5)
Qualifications
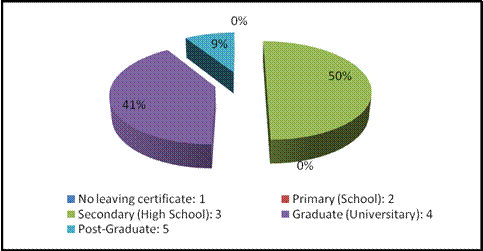
Figure 5. Qualifications (Net-Mex
Ltd., Hungary)
6)
Current occupation/job
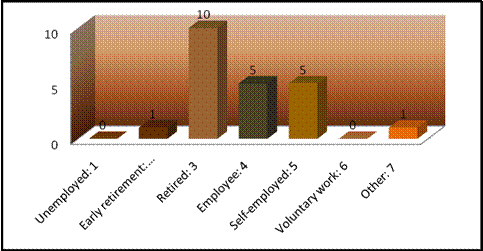
Figure 6. Current occupation
(Net-Mex Ltd., Hungary)
7) Need to
learn how to use ICTs
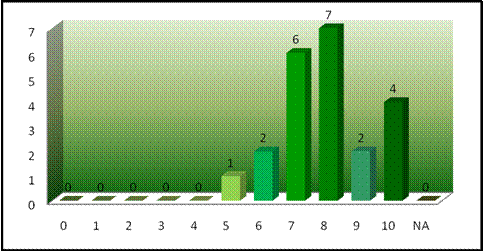
Figure 7. Need to learn ICTs
(Net-Mex Ltd., Hungary)
8)
Interest in ICTs
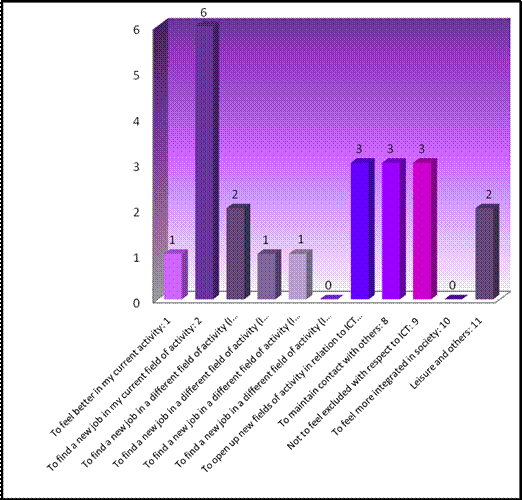
Figure 8. Interest in ICTs
(Net-Mex Ltd., Hungary)
9) What do
you mainly use ICTs for?
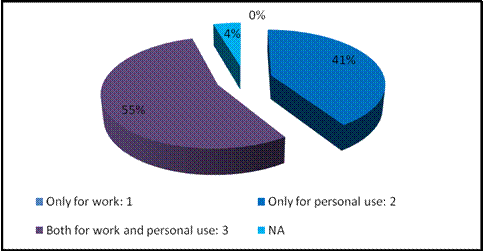
Figure 9. Uses of ICTs
(Net-Mex Ltd., Hungary)
10)
State
those ICTs that you have at home and use regularly
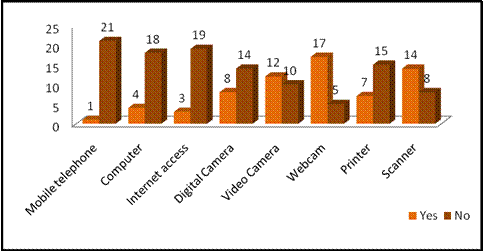
Figure 10. ICTs at home
(Net-Mex Ltd., Hungary)
11)
Can
you count on someone to help you if you have problems when using the ICTs?
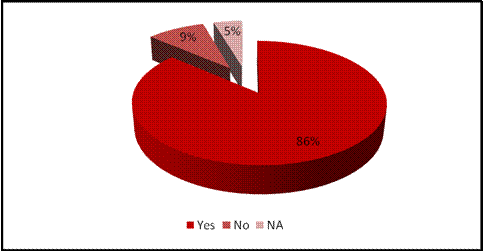
Figure 11. Help in ICTs
(Net-Mex Ltd., Hungary)
12) Who helps you when you find
difficulties in using ICTs?
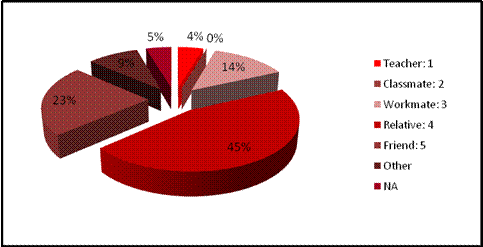
Figure 12. People helping in
ICTs (Net-Mex Ltd., Hungary)
13) What do you use your PC for?
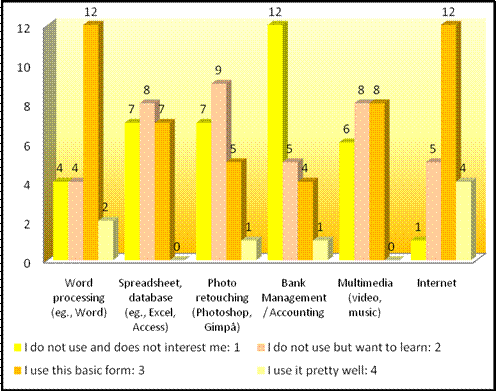
Figure 13. Uses of a PC
(Net-Mex Ltd., Hungary)
14) What do
you use the Internet for?
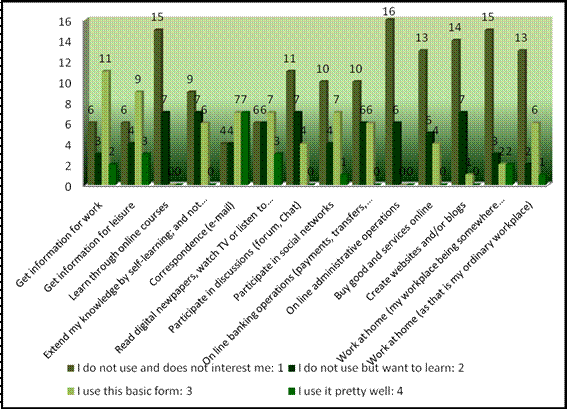
Figure 14. Uses of Internet
(Net-Mex Ltd., Hungary)
15) How many
hours a week do you usually use your PC?
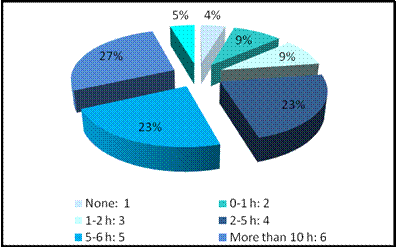
Figure 15. Hours a week using
a PC (Net-Mex Ltd., Hungary)
16) How many hours a week do you
usually surf the Internet?
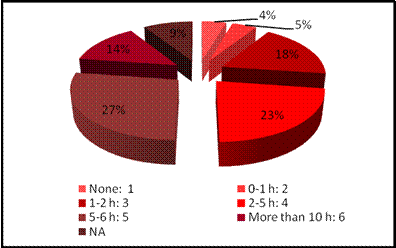
Figure 16. Hours a week using
Internet (Net-Mex Ltd., Hungary)
17) Range from 1 to 5
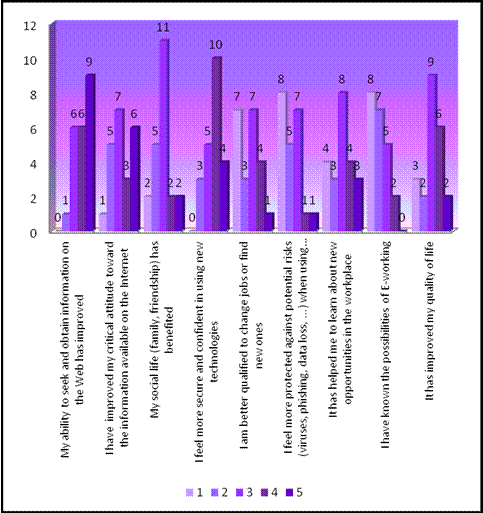
Figure 17. Range from 1 to 5
(Net-Mex Ltd., Hungary)
STATISTICAL
ANALYSIS FOR THE FRENCH CASE:
|
CHART OF DATA |
|
|
The
total group under study (N) |
|
|
Participants
(n) |
|
|
Percentage
of population having or lacking the characteristic under study (p = q) |
|
|
Reliability |
|
|
Units
of standard deviation in the normal distribution (Z) |
|
|
Standard error (SE) |
|
1) Sex
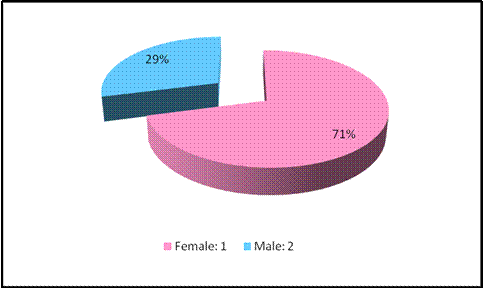
Figure 1. Sex (E-Seniors,
France)
2) Marital
status
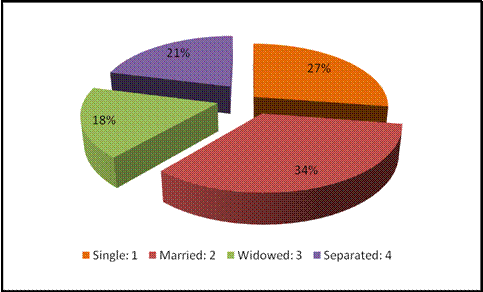
Figure 2.
Marital status (E-Seniors, France)
3)
Age
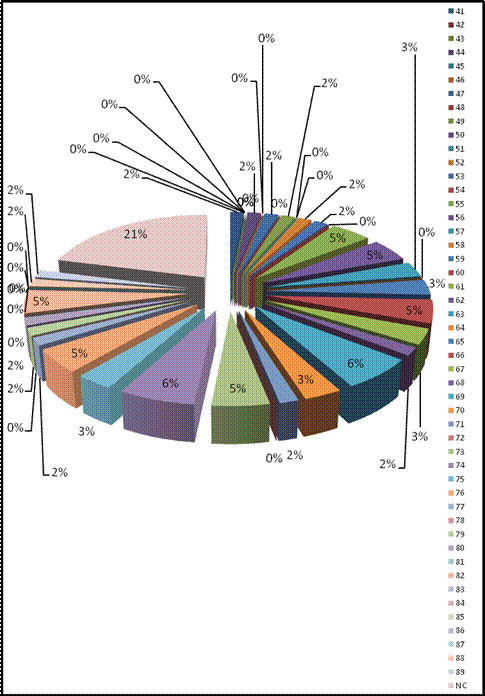
Figure 3. Age (E-Seniors, France)
4)
Do you live alone?
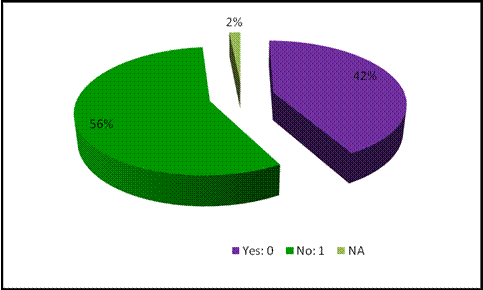
Figure 4. Living alone (E-Seniors, France)
5)
Qualifications
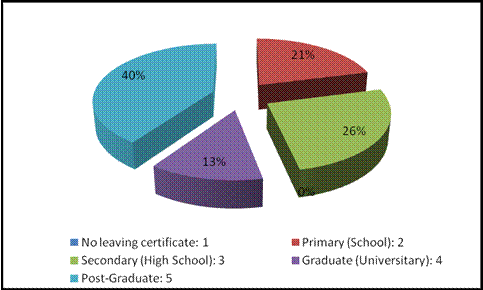
Figure 5. Qualifications (E-Seniors, France)
6)
Current occupation/job
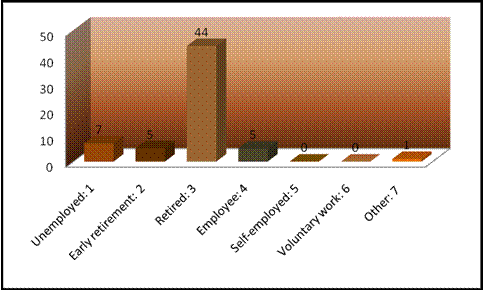
Figure 6. Current occupation (E-Seniors,
France)
7) Need to
learn how to use ICTs
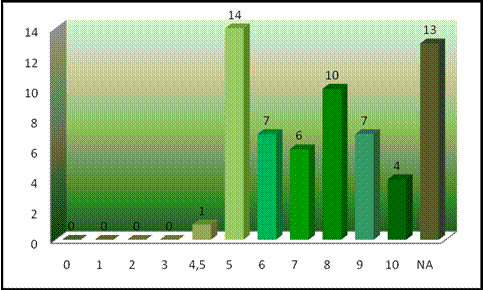
Figure 7. Need to learn ICTs (E-Seniors,
France)
8) Interest
in ICTs
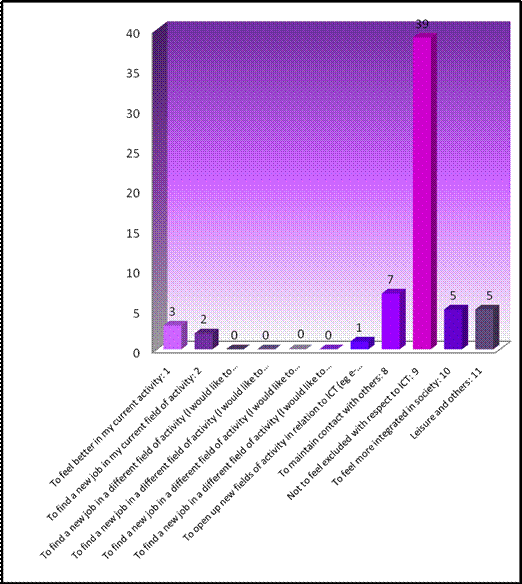
Figure 8. Interest in ICTs (E-Seniors, France)
9) What do
you mainly use ICTs for?
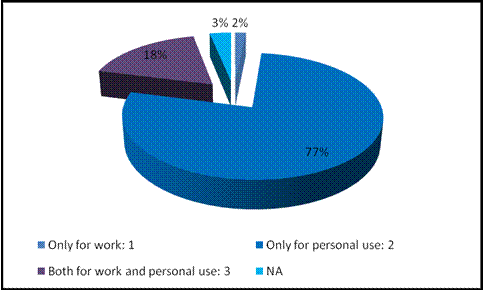
Figure 9. Uses of ICTs (E-Seniors, France)
10)
State
those ICTs that you have at home and use regularly
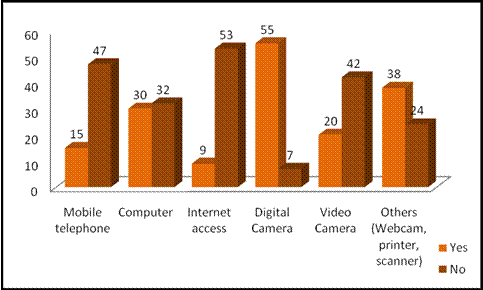
Figure 10. ICTs at home (E-Seniors, France)
11)
Can
you count on someone to help you if you have problems when using the ICTs?
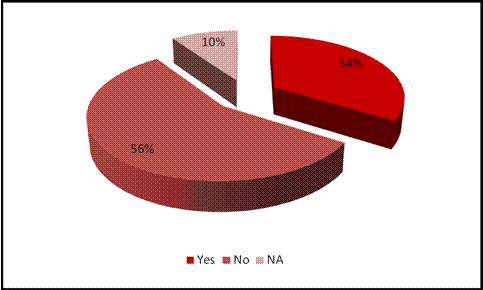
Figure 11. Help in ICTs (E-Seniors, France)
12) Who helps you when you find
difficulties in using ICTs?
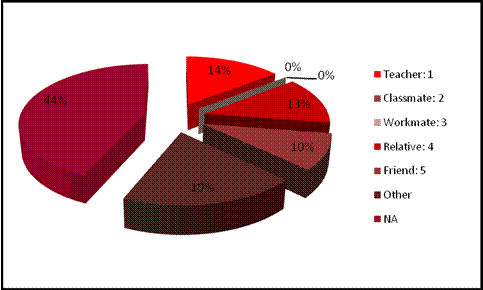
Figure 12. People helping in
ICTs (E-Seniors, France)
13) What do you use your PC for?
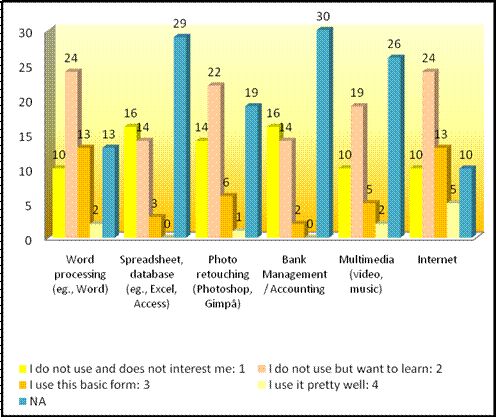
Figure 13. Uses of a PC (E-Seniors, France)
14) What do you use the Internet for?
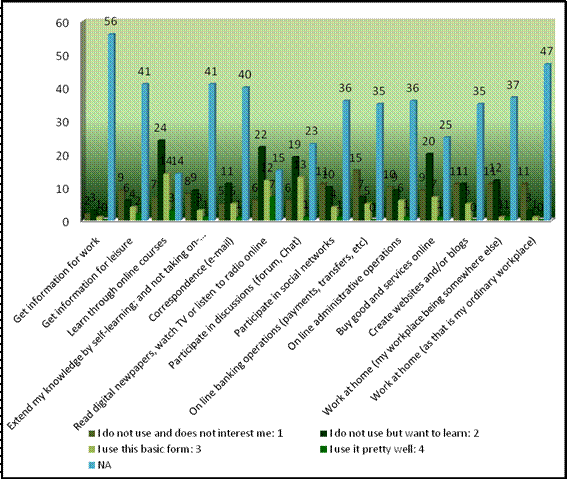
Figure 14. Uses of Internet (E-Seniors, France)
15) How many hours a week do
you usually use your PC?
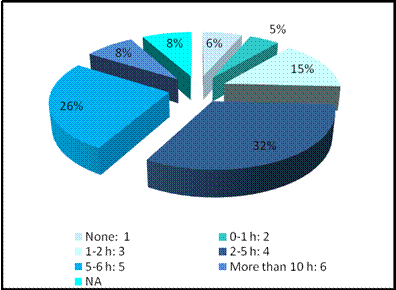
Figure 15. Hours a week using
a PC (E-Seniors, France)
16) How many hours a week do you
usually surf the Internet
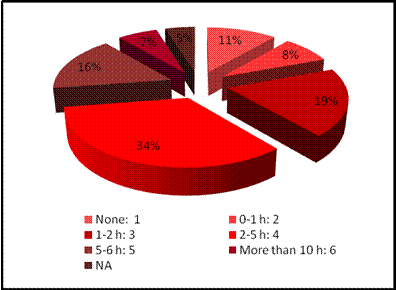
Figure 16. Hours a week using
Internet (E-Seniors, France)
17) Range
from 1 to 5
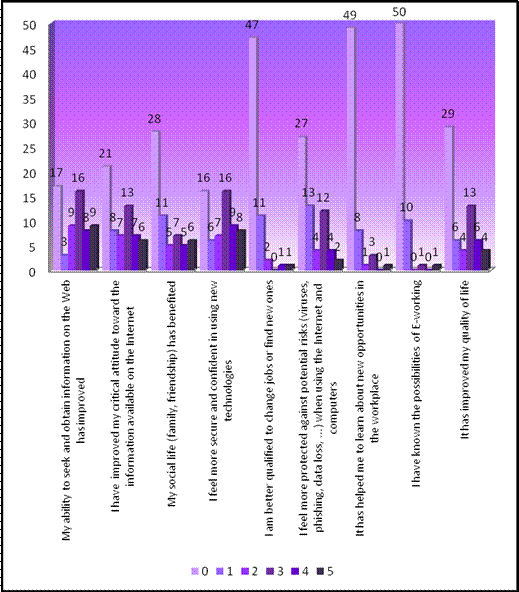
Figure 17. Range from 1 to 5
(E-Seniors, France)